Families across the United States keep running into the same problem. Their family member gets an autism diagnosis, the doctor recommends applied behavior analysis (ABA) therapy, but the hard part is finding someone nearby who can help them. Autism diagnoses keep rising, but families may sit on waitlists for months or drive hours to reach the nearest clinic for autism care. There simply aren’t enough providers in many areas, creating ABA care deserts across the nation.
We wanted to understand exactly where ABA provider shortages exist and how these gaps are changing over time, so we dug into the numbers. Our analysis looks at where Board Certified Behavior Analysts (BCBAs), Board Certified Assistant Behavior Analysts (BCaBAs) and Registered Behavior Technicians (RBTs) are actually practicing and where they’re not. All the data comes from publicly available sources and reveals a system under serious strain.
What We’re Actually Talking About
We focus on applied behavior analysis and related services, which are essential in many autism treatment plans. The professionals we tracked all get their certifications from the Behavior Analyst Certification Board (BACB), including:
-
- BCBA and BCBA-D: Master’s or doctoral-level clinicians who design and supervise treatment plans.
-
- BCaBA: Bachelor-level clinicians who work under BCBA supervision.
-
- RBT: Technicians who deliver day-to-day therapy under supervision.
You’ll find these professionals in behavioral health clinics, schools, homes and community settings. Because these professionals are the providers of most autism care plans, tracking where they work gives us a pretty clear picture of where families can and can’t find services.
Where the Numbers Come From
To keep things fully transparent, every number comes from a public dataset or a peer-reviewed paper:
-
- BACB certificant counts by credential and state, as of October 2025
-
- BACB Annual Data Reports 2020–2024 for national growth trends in BCBA, BCaBA and RBT certifications
-
- CDC Autism Spectrum Disorder data for autism prevalence among 8-year-old children, which found that 1 in 31 across monitored communities had an autism diagnosis in 2022 (about 3.2%)
-
- U.S. Census for 2024 population estimates by single year of age for those aged 21 or younger (about 91 million)
-
- Peer-reviewed ABA workforce research, including studies showing that around 72% of BCBAs primarily practice within autism spectrum disorders
For national “need vs supply” estimates, we used:
-
- CDC’s 3.2% autism prevalence among 8-year-olds as a rough estimate for autism across those aged 21 or younger, with the understanding that this is just one benchmark.
-
- Focus on people 21 or younger, since BACB professionals primarily provide behavioral health to individuals under this age
-
- Assume a conservative caseload of 8 clients with autism per BCBA clinician, which workforce studies use as a planning benchmark rather than an official standard.
Wherever we make estimates, rather than stating hard facts, we ensure we flag them as such.
The National Picture: We’re Falling Further Behind
How Common Is Autism?
The latest estimate from the CDC’s Autism and Developmental Disabilities Monitoring (ADDM) Network indicates that about 3.2% of 8-year-olds (1 in 31) are on the autism spectrum in the communities it monitors. Early monitoring efforts from 20 years ago saw rates closer to 1 in 150, an increase of more than four times in roughly a single generation.
Most researchers point to better awareness, broader diagnostic criteria and more consistent screening as the primary reasons for this increase, not a new cause that suddenly made more children develop autism. In other words, improvements in the areas mentioned have helped reveal children with autism who likely would’ve been missed or misdiagnosed in the past.
How Many Children and Young Adults May Need ABA?
If you apply the CDC’s 3.2% rate to the entire U.S. population in July 2024 (about 340.1 million), you get nearly 10.9 million people on the spectrum nationwide. However, since the majority of BCBA clinicians only see clients ages 21 or younger, we used this number to demonstrate our behavioral health care deserts in all our tables and charts.
Among this population (about 91 million), using the 3.2% rate, approximately 2.9 million are on the spectrum. While this is a simple estimate and not a true head count, it helps you understand the scale of potential need.
How Many BCBAs Are Available Right Now?
As of October 24, 2025, the BACB reports that within the United States specifically, there are:
-
- 71,371 BCBAs
-
- 2,915 BCBA-Ds
-
- 4,086 BCaBAs
-
- 242,327 RBTs
-
- 320,699 total BACB certificants
However, only BCBAs and BCBA-Ds are supervisor-level clinicians who design the treatment plans. Thus, the U.S. has about 74,286 supervisor-level clinicians available. We use this number for our shortage estimates, as those professionals on the rung below BCBAs can’t independently create or initiate treatment plans.
How Many Would We Need?
Here’s where the shortages become apparent. Using our simple planning scenario:
-
- Estimated people aged 21 or younger on the autism spectrum: About 2.9 million
-
- If each BCBA-level clinician serves 8 clients (2.9 million divided by 8)
-
- Number of BCBAs needed: About 362,500
-
- Shortage: About 288,214
Even before we factor in anything else, we need nearly 5 times as many BCBA-level clinicians as we have right now in the United States. Remember, this is a conservative scenario.
Furthermore, not every BCBA works in autism care. A survey of the ABA workforce found that only about 72% of BCBAs report autism as their primary area of practice. If we apply that 72% to the BCBA-level workforce in the U.S.:
-
- BCBA-level clinicians: 74,286
-
- Estimated number working primarily in autism (72%): About 53,486
-
- Estimated number of additional BCBAs needed: About 309,000
But that’s before we consider:
-
- Other behavioral health needs (e.g., intellectual disability, challenging behavior, trauma)
-
- Non-clinical duties like supervision, training and admin duties
-
- Uneven distribution across states, cities and rural regions
While the BACB indicates that more people are becoming certified, with steady growth among all levels of behavioral health professionals and plenty of jobs awaiting these providers, the workforce simply isn’t growing fast enough. As certifications climb, so does autism identification. As screening improves and awareness grows, more children are being diagnosed at earlier ages.
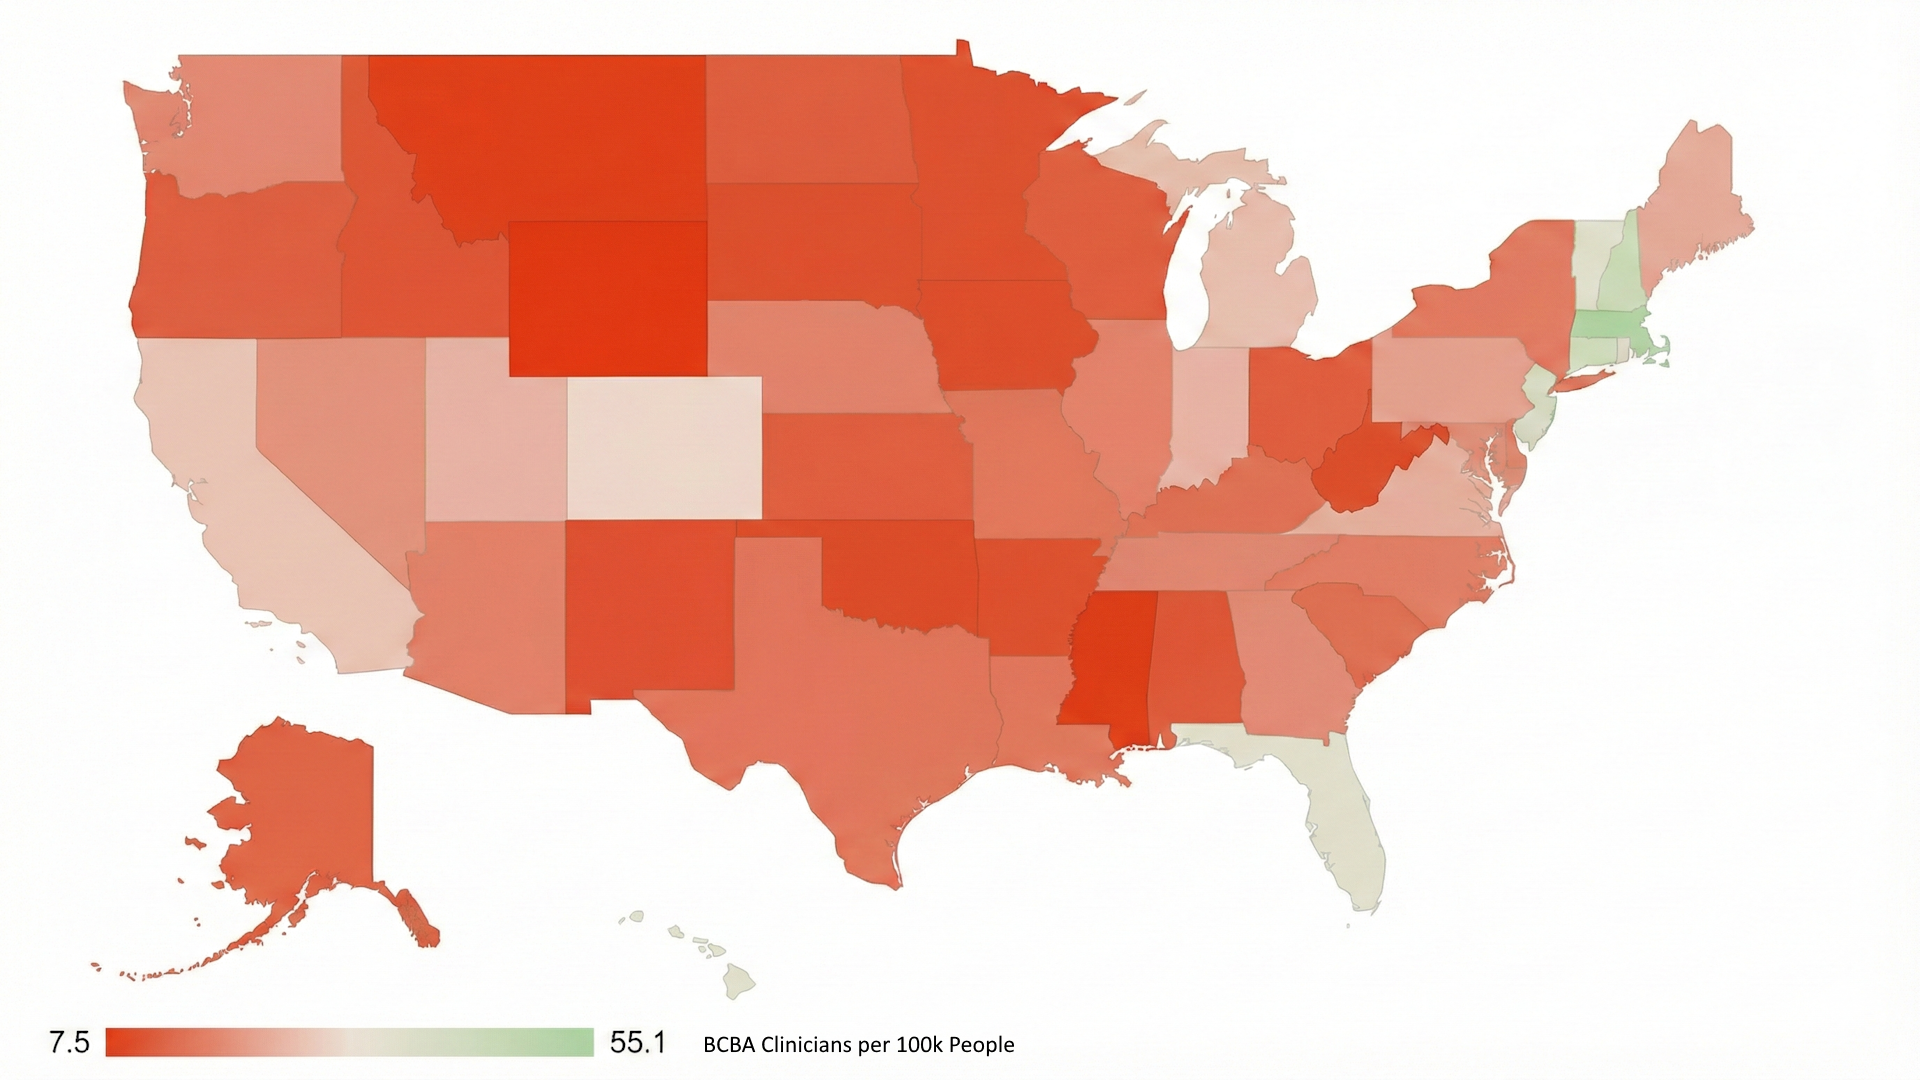
State-by-State: Where Providers Actually Live
Families are more impacted by the lack of access in their own states, not nationally. Thus, we looked at how many BCBA and BCBA-D clinicians each state has relative to its overall population in 2024. This data helps us better understand where the ABA care deserts are across the nation.
For each state, we calculated:
-
- Certificants per 100,000 residents by dividing BCBAs by the state population multiplied by 100,000
This calculation gives us a simple way to compare workforce density across states, regardless of population size.
Table: Certified BCBA & BCBA-D Clinicians per 100k People by State
| State | BCBA + BCBA-D Clinicians Only | State Population 2024 | BCBA Clinicians per 100k People |
| Massachusetts | 3,931 | 7,136,171 | 55.1 |
| New Hampshire | 643 | 1,409,032 | 45.6 |
| Connecticut | 1,541 | 3,675,069 | 41.9 |
| New Jersey | 3,729 | 9,500,851 | 39.2 |
| Hawaii | 531 | 1,446,146 | 36.7 |
| Florida | 8,407 | 23,372,215 | 36 |
| Vermont | 232 | 648,493 | 35.8 |
| Rhode Island | 398 | 1,112,308 | 35.8 |
| Colorado | 1,760 | 5,957,493 | 29.5 |
| California | 10,682 | 39,431,263 | 27.1 |
| Michigan | 2,687 | 10,140,459 | 26.5 |
| Indiana | 1,761 | 6,924,275 | 25.4 |
| Utah | 872 | 3,503,613 | 24.9 |
| Virginia | 2,146 | 8,811,195 | 24.4 |
| Maine | 336 | 1,405,012 | 23.9 |
| Pennsylvania | 2,954 | 13,078,751 | 22.6 |
| Nevada | 667 | 3,267,467 | 20.4 |
| Maryland | 1,236 | 6,263,220 | 19.7 |
| Georgia | 2,189 | 11,180,878 | 19.6 |
| Washington | 1,530 | 7,958,180 | 19.2 |
| Tennessee | 1,389 | 7,227,750 | 19.2 |
| Nebraska | 376 | 2,005,465 | 18.7 |
| Illinois | 2,341 | 12,710,158 | 18.4 |
| North Carolina | 1,950 | 11,046,024 | 17.7 |
| Arizona | 1,344 | 7,582,384 | 17.7 |
| Delaware | 180 | 1,051,917 | 17.1 |
| Louisiana | 780 | 4,597,740 | 17 |
| New York | 3,350 | 19,867,248 | 16.9 |
| Missouri | 1,046 | 6,245,466 | 16.7 |
| Texas | 5,181 | 31,290,831 | 16.6 |
| Kentucky | 713 | 4,588,372 | 15.5 |
| South Carolina | 832 | 5,478,831 | 15.2 |
| Alaska | 102 | 740,133 | 13.8 |
| North Dakota | 104 | 796,568 | 13.1 |
| Oregon | 550 | 4,272,371 | 12.9 |
| Kansas | 382 | 2,970,606 | 12.9 |
| District of Columbia | 90 | 702,250 | 12.8 |
| Ohio | 1,501 | 11,883,304 | 12.6 |
| Wisconsin | 731 | 5,960,975 | 12.3 |
| Idaho | 239 | 2,001,619 | 11.9 |
| Alabama | 609 | 5,157,699 | 11.8 |
| New Mexico | 234 | 2,130,256 | 11 |
| South Dakota | 101 | 924,669 | 10.9 |
| Arkansas | 332 | 3,088,354 | 10.8 |
| Minnesota | 618 | 5,793,151 | 10.7 |
| West Virginia | 186 | 1,769,979 | 10.5 |
| Iowa | 331 | 3,241,488 | 10.2 |
| Oklahoma | 403 | 4,095,393 | 9.8 |
| Montana | 97 | 1,137,233 | 8.5 |
| Mississippi | 239 | 2,943,045 | 8.1 |
| Wyoming | 44 | 587,618 | 7.5 |
Top 10 States with the Most Providers Per Capita
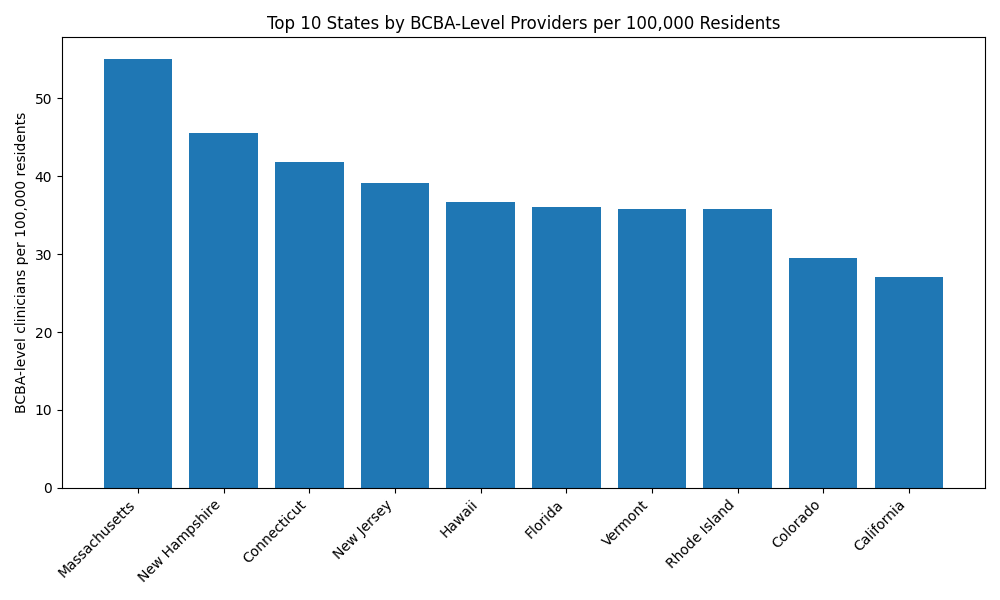
Using the numbers for BACB and BACB-D credentials combined, the following list contains the top 10 states with the most BACB clinicians per 100,000 residents in 2024 (numbers are rounded):
-
- Massachusetts: 55.1
- New Hampshire: 45.6
- Connecticut: 41.9
- New Jersey: 39.2
- Hawaii: 36.7
- Florida: 36.0
- Vermont: 35.8
- Rhode Island: 35.8
- Colorado: 29.5
- California: 27.1
Several of these states, like Massachusetts and New Jersey, have a long-standing concentration of universities, hospital systems and autism specialty centers, which help attract and retain BCBA clinicians. For families, this means that in these states, it’s relatively easier to find behavioral health clinics and autism care providers close to home, but pockets where there are shortages still exist.
Bottom 10 States with the Fewest Providers per Capita
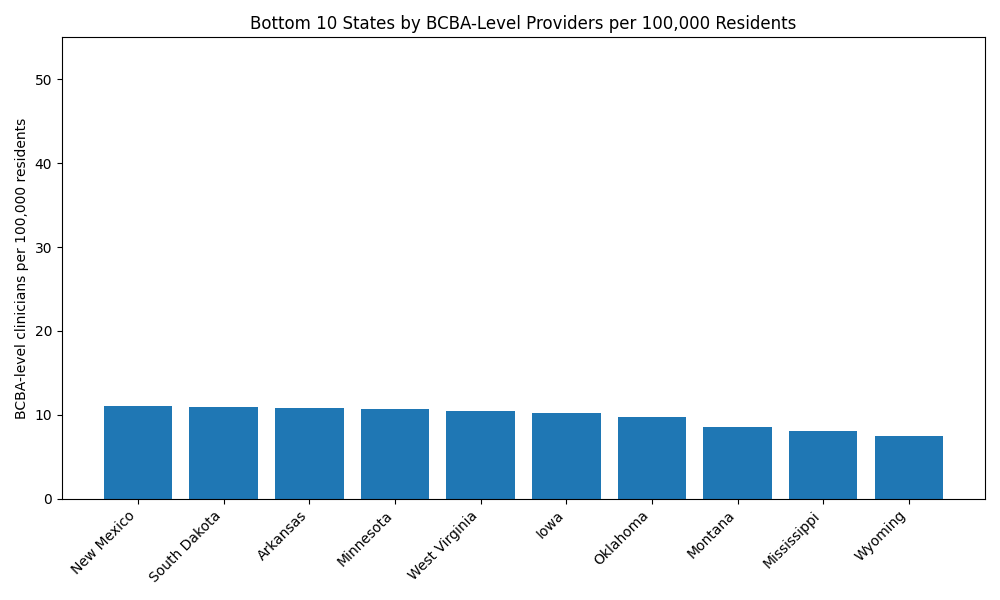
Using the same data, we compiled the following list of 10 states with the least number of certified clinicians per 100,000 residents in 2024:
42. New Mexico: 11
43. South Dakota: 10.9
44. Arkansas: 10.8
45. Minnesota: 10.7
46. West Virginia: 10.5
47. Iowa: 10.2
48. Oklahoma: 9.8
49. Montana: 8.5
50. Mississippi: 8.1
51. Wyoming: 7.5
Some of these states are small or have lots of rural, sparsely populated areas where residents must travel long distances to reach the limited number of health systems. Others are pockets with large populations, but still suffer from having relatively few BCBA-level clinicians per capita. While the rural areas are probably ABA deserts, even the urban areas still likely have waitlists.
How Headcounts Relate to Care Deserts and Need-to-Supply Ratios
Per-capita BCBA clinician counts only tell part of the story. To get an even clearer picture, we compared the number of BCBAs available to the number needed to create a simple need-to-supply ratio for each state. We did this by:
-
- Taking the state’s 2024 population estimation
- Estimating the share likely to be age 21 or younger
- Applying the uniform 3.2% autism rate
- Dividing by 8 clients per BCBA as the assumed conservative caseload
- Comparing that to how many BCBA/BCBA-D professionals the state actually has
These calculations give us the ideal number of BCBA-level clinicians, which we can then compare to the actual number for each state. Lower numbers mean better access, while higher numbers mean more severe care deserts.
We didn’t publish a full 50-state ratio table here because the actual share of the population within our age range within each state adds another layer of estimation. However, the pattern lines up closely with the BCBA per capita above, and a few patterns jump out:
-
- States that already rank high on BCBA-level per capita (Massachusetts, New Jersey, Florida) still look relatively strong when we compare the estimated child need-to-supply ratio.
-
- States with low BCBA levels (Wyoming, Mississippi, Montana) potentially face much steeper caseloads per clinician, especially in rural counties.
-
- Rural states often rely heavily on a small number of BCBAs clustered in one or two cities, leaving large areas without any local behavioral health clinics providing autism care.
-
- Urban states with low ratios might have strong specialty hubs in a few major cities, but suburbs and rural areas may still struggle with access, travel times and long waitlists.
However, this model isn’t perfect. It uses a single national autism rate and a fixed caseload assumption, so it’s not precise. But it highlights the direction and severity of the mismatch between estimated need and the supply of available supervisory clinicians.
What About Clinics, Not Just Individual Providers?
Families don’t look for care by reading certification registries. They look for actual behavioral health clinics, autism centers or school-based programs that employ certified providers. Unfortunately, the data gets thinner here because:
-
- There’s no single national registry of autism-specific behavioral health clinics.
-
- The Substance Abuse and Mental Health Services Administration’s (SAMHSA) Behavioral Health Treatment Services Locator lists mental health and substance use facilities, but doesn’t consistently flag autism-specific ABA programs.
-
- The Health Resources and Services Administration’s (HRSA) Health Professional Shortage Area designations identify mental health shortage areas but don’t single out ABA or autism care.
Because of this, the most reliable nationwide view we have right now is the distribution of certified BCBAs. However, clinics tend to open where credentialed professionals are available and close when they’re not, so our certificant per-capita numbers may offer a reasonable estimate of the density of autism-focused ABA clinics.
Why Some States Look Good on Paper But Not in Reality
Even in states that look well-supplied on paper, families often describe the same access problems. A few reasons why include:
-
- Uneven distribution within the state: Many BCBAs cluster in major cities, leaving rural counties without any local autism care and requiring long drives to receive it.
-
- Insurance and payor issues: Medicaid coverage rules, commercial insurance carve-outs and low reimbursement rates limit what behavioral health clinics can offer, even when they’re hiring for BCBA jobs.
-
- Not everyone works clinically. Some certificants work in schools, research, policy or consulting, not direct autism care, making the clinical workforce smaller than the raw certification count suggests.
-
- Burnout and turnover. High caseloads, low pay and mountains of paperwork push some clinicians out of direct practice, making BCBA jobs hard to fill or keep filled.
These factors help explain why families in supposedly “provider-rich” states still struggle with access, and why BCBA job openings in certain areas remain unfilled for months, if not longer.
The Big Picture: A Nation of Overlapping Care Deserts
When you zoom out from the state-by-state details and look at the issue on a national scale, a few themes emerge:
-
- There’s a national shortage, not just local gaps. Even under a conservative caseload scenario, the nation appears to need nearly five times as many BCBA-level clinicians to meet autism care needs for those aged 21 or younger alone. This shortage can’t be fixed simply by shuffling providers between states.
- The field is growing fast but still can’t catch up. BCBA certifications are climbing rapidly, but CDC data shows autism identification is rising even faster in many communities.
- Rural communities are hit hardest. States like Wyoming, Montana and New Mexico have very few certificants spread across huge areas. In practice, it means families rely on telehealth, experience long commutes or go without care.
- Some large states are quietly underserved. States like Minnesota don’t fit the stereotype of “care deserts,” but their low clinician-per-capita rates suggest hidden access problems outside major cities.
- Behavioral health clinics face a structural workforce bottleneck. There simply aren’t enough BCBA-level clinicians to supervise all the RBTs you’d need to serve everyone who might benefit from autism care. This shortage limits how quickly behavioral health clinics can grow, even when demand is high.
What It Means for BCBA Jobs, Autism Care and Behavioral Health Policy
From a workforce perspective, the data points to:
-
- Ongoing demand for BCBA jobs, especially in lower-density states and rural areas, where a single new clinic can dramatically change access.
-
- A strong need for policies that support training, supervision and retention of RBTs, since they multiply the impact of each BCBA.
-
- A growing case for telehealth-enabled behavioral health clinics to bridge at least part of the gap for families in care deserts.
From a policy and planning angle, states can:
-
- Use BACB certificant data and Census population estimates together as a simple way to track workforce growth and care deserts over time.
-
- Factor in Medicaid claims, school-based service data and SAMHSA facility data to create a more detailed map of ABA clinics and autism care hot spots.
-
- Target scholarships, loan repayment and licensure reforms within the states and regions with the most significant estimated shortages.
Conclusion: The Map Doesn’t Match the Need
The United States has built a growing workforce of behavior analysts and technicians, but the geography of autism care still doesn’t line up with where children and families actually live. Even with generous assumptions, the nation has far too few BCBA-level clinicians to meet potential demand. State by state, those gaps deepen into true ABA care deserts, especially in rural areas and in large states with surprisingly low providers per capita.
Closing that gap will take more than opening a few new ABA clinics. It’ll require:
-
- Expanding training pipelines to graduate more BCBAs
-
- Supporting BCBA jobs in underserved areas, possibly through loan repayment or other incentives
-
- Making it sustainable for clinics to deliver autism care in communities that have been overlooked
The data already tells a clear story. The next step is deciding what we’re willing to do so that families who need help can actually find it.